EKE VWap
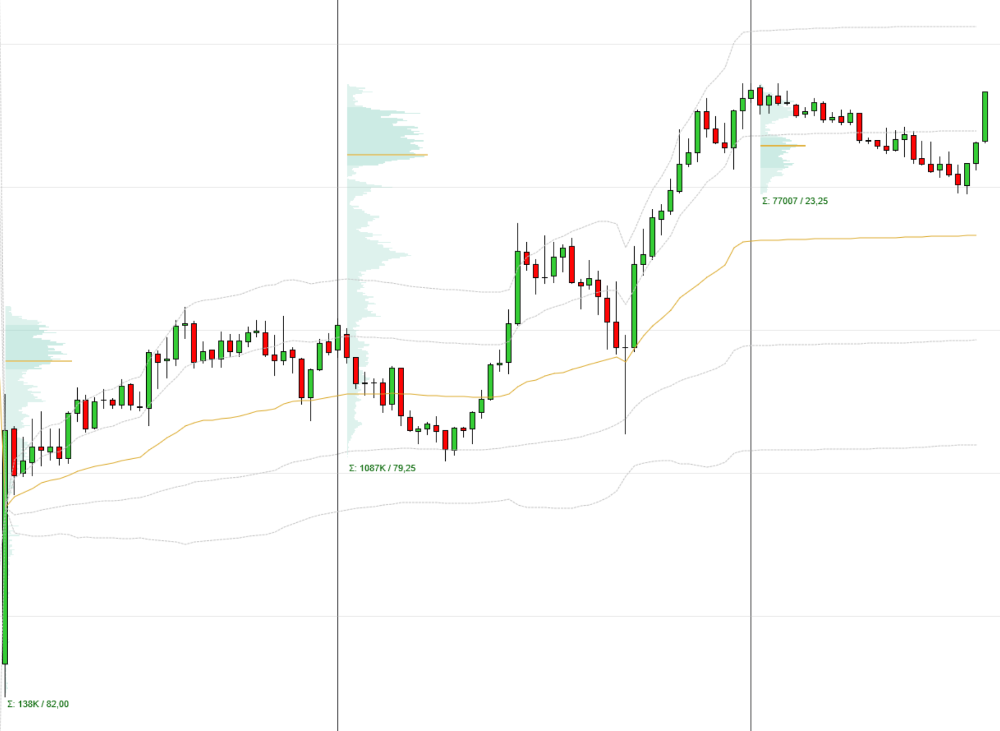
The EKE VWAP Indicator plots the Volume Weighted Average Price with optional standard deviation lines, giving traders powerful insights into market value areas across multiple timeframes. Whether you're day trading or swing trading, this tool helps you identify key support and resistance zones based on volume distribution
Fully Customizable
You can choose which VWAP timeframes to display — sessions, daily, weekly, monthly, or yearly — and customize the color, line style, and thickness of each line. Easily toggle the visibility of the VWAP or any deviation lines directly from the settings panel.
Deviation Lines
The indicator includes two deviation bands by default (±1 and ±2 standard deviations), but you're free to adjust them to any value. Use them to identify overbought or oversold conditions, potential reversal zones, or areas of interest for entries and exits.
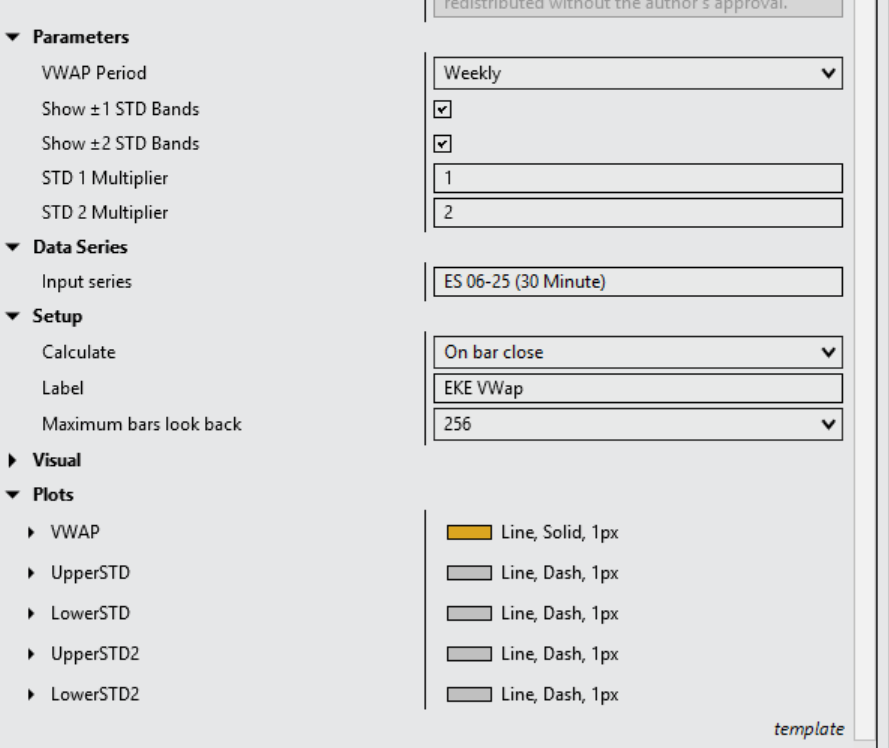
VWAP Period Selection
This VWAP indicator offers flexible period selection to suit any trading style. Choose from standard timeframes such as Daily, Weekly, Monthly, and Yearly, or select session-specific VWAPs for the Tokyo, London, and New York trading sessions. This allows for precise volume-weighted average price tracking tailored to global market activity